(August 2021)
Note: If you are not familiar with astrology, this article will explain some concepts for you. <Click Here>
According to traditional astrology techniques, the outcome of a state election can be determined by looking at the seasonal ingress chart for the season the election is held. In this method, the government is represented as the 10th house, and the opposition is the 4th house. In Canadian politics, there are several parties, and typically one running the government even in a minority government situation.
In the traditional, method the 10th house and its ruler represent the government. The 4th house represents the opposition party or parties and its ruler. The ingress chart can typically ascertain the status of the government and the result of the election.
Justin Trudeau and the Liberals hold a minority government in 2021 and have decided to call a flash election during the summer, with the election date set for 20 September 2021. This is still a summer election.
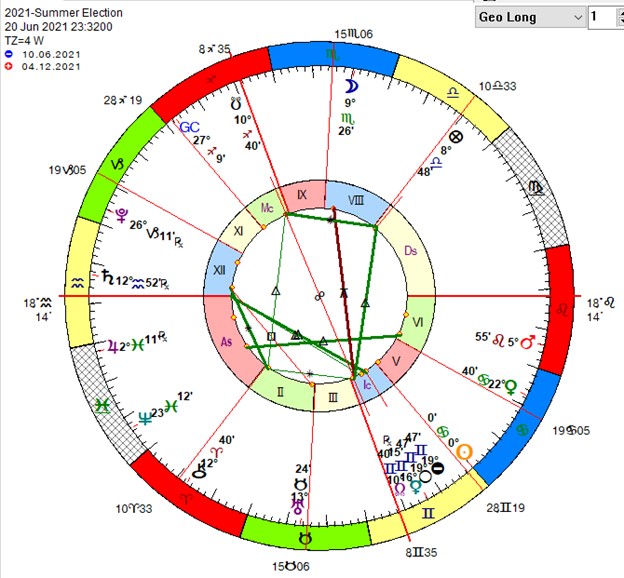
In this chart, Jupiter, ruler of the 10th house, is in the 1st house of the people, and it is in its own sign, but it is retrograde and intercepted, which doesn’t bode well for the incumbent. Jupiter is in a trine with the Moon or the people, but the Moon is separating from Jupiter, meaning the people are losing faith in the leader. On the other hand, Jupiter is in an applying aspect to the Sun (leader), suggesting there is a chance he can become the leader once more. Jupiter is in a square aspect to the 4-10th house axis meaning there could be some difficulty making it back into power.
Mercury, the ruler of the 4th house of the opposition, is in the 4th house of the opposition. This could mean that the opposition will remain as the opposition.
The other interesting point of this chart is the previous eclipse is in the 4th house. Eclipses tend to represent harsh/traumatic events, and with the eclipse in the 4th house suggests the opposition will have an event that may turn against them.
The Moon represents the people of the nation. In this case, the Moon is in a separating trine aspect to the ruler of the government. While this means the people have a favourable connection to the government but are moving away from it. A 150° aspect is a difficult one, and it suggests adjustments are to be made. The Moon is connecting to the North Node in the house of the opposition. This could delineate a period where the public gravitates to the opposition in order to make a change and make some desired adjustments. The Moon is, after all, in the 8th house of “death” or transformation.
I originally stated this would be a clear win for the incumbent. Still, if we look at historical data of Canadian elections, one can see that the ruler of the 4th house of the opposition in the 4th house equated to two losses versus one victory. The opposition is more likely to lose if the ruler is in the 7th and 9th rather than in the 4th.
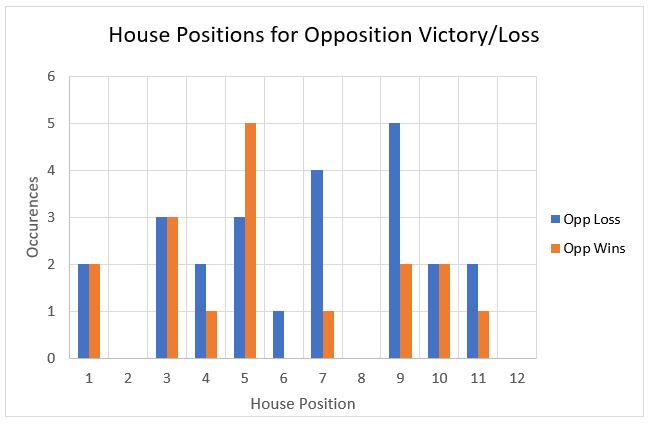
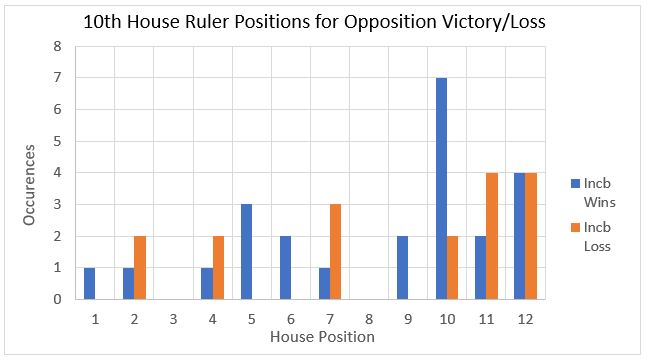
However, if the ruler of the 10th house of the government is in the 10th house, it will be a victory for the incumbent. This chart does not have that configuration.
If we look at the position of the Sun, which signifies the King/Queen, in house position, it might give us a clearer indication. The Sun in the 5th has only been in charts of incumbent wins, but there have only two.
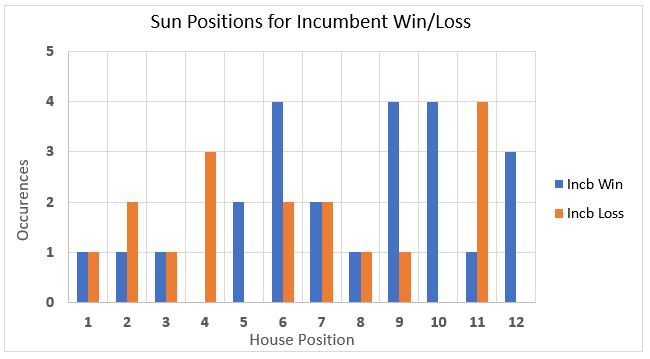
By examining these results, it is now becoming more challenging to determine a clear winner.
ADDITIONAL ANALYSIS
Typically, in delineating charts, there are several aspects to take into consideration. With Alphee Lavoie’s Fast Research we can statistically examine criteria to a study group using a control group.
In this study, I have examined planetary positions, both in sign and house, aspects, rulership consideration for 4th and 10th house, and midpoint trees. All the astrological factors are taken into account for the seasonal ingress for each Canadian election and are inputted into a Neural Network (aka Artificial Intelligence model). There were three studies created based on the astrological phenomena where the model calculates an outcome.
The three models created were for:
• Incumbent winning (control group: incumbent losing)
• Liberal Party of Canada victory (control group: Liberals losing)
• Majority victories (control group: minority victory)
UNDERSTANDING THE RESULTS
The following explains how to understand the results. If there is a red bar all the way across, it signifies 100% YES. If there is a little blue tab on the left side, it represents a 100% NO.
If the study is set to determine the winner, and we input the past winners into the Neural Network, we should see all red indicating they have won. Conversely, if we input the past losers in the model, which predicts all the winners, then the charts of the losers should be all white with a small blue bar.
INCUMBENT WINNERS
Charts of Incumbent wins Charts of Incumbent losses.
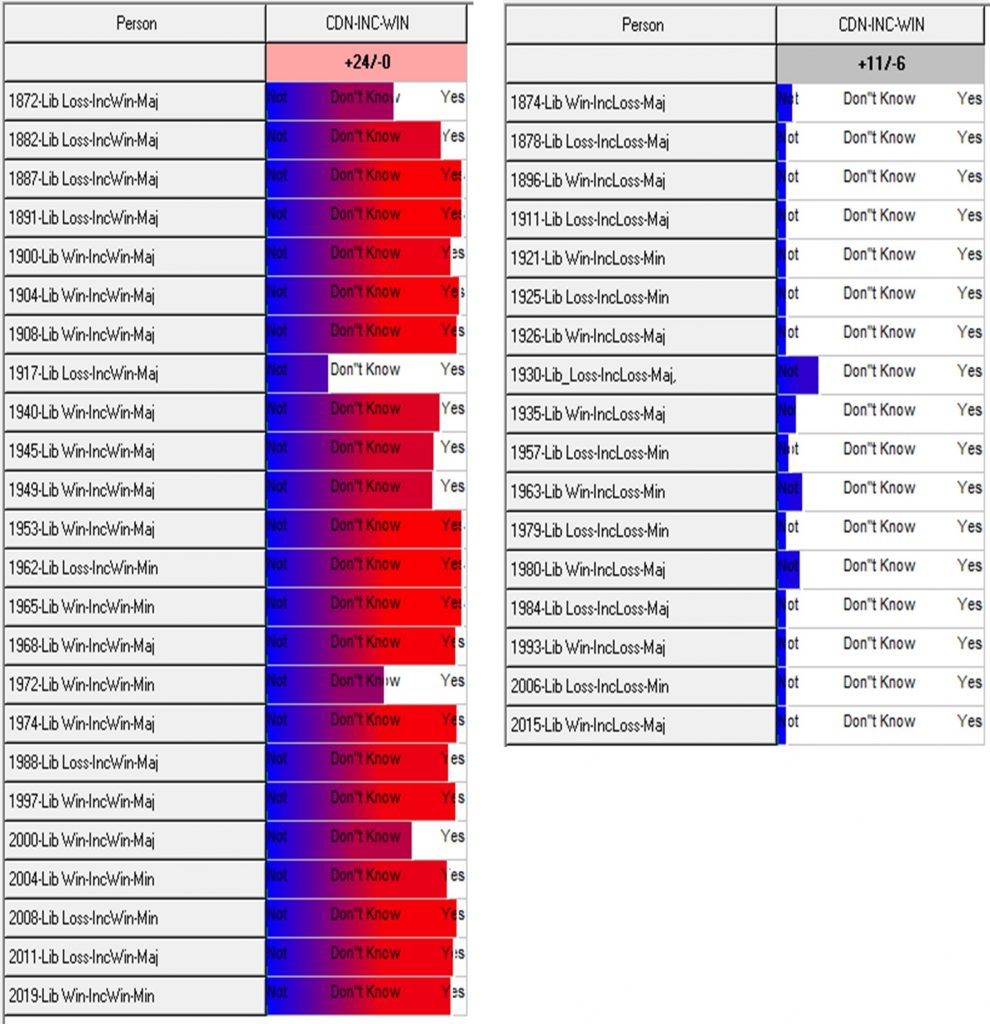
The model can pick the winner with a 90% confidence 83% of the time but above 65% confidence over 95% of the time.
The model can predict the loser with 75% or greater confidence 100% of the time.
LIBERAL WINNERS
Charts of Liberal wins Charts of Liberal losses.
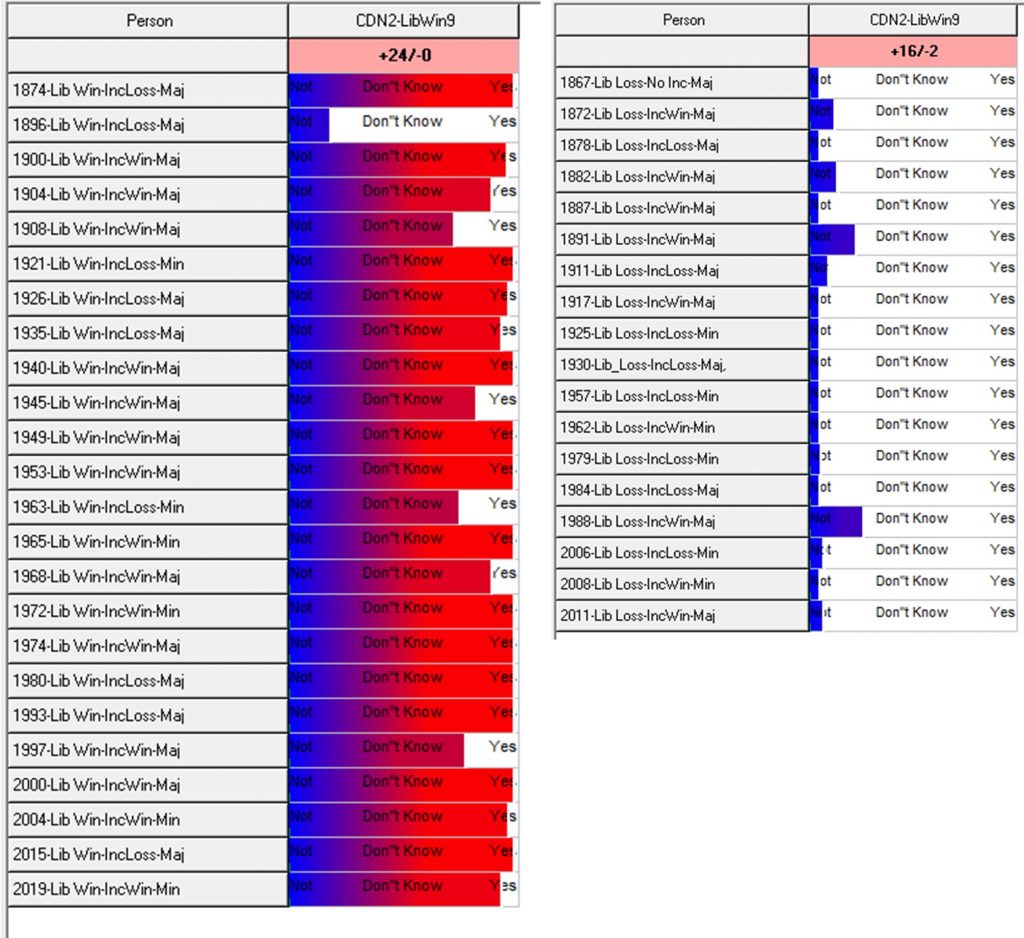
The model can pick the Liberal Party victory with a 75% confidence 95% of the time.
The model can predict the Liberal Party loss with 75% or greater confidence 100% of the time.
MAJORITY GOVERNMENT
Charts of Majority governments Charts of Minority governments

The model can pick the Liberal Party victory with an 80% confidence 93% of the time.
The model can predict the Liberal Party loss with 75% or greater confidence 100% of the time.
2021 ELECTION
The three models appear to be functioning at a reasonably accurate rate. What do the models predict for the 2021 election?

The Liberals are the incumbent in this election. The interesting factor is that both models for the incumbent party and the Liberal Party winning indicate about a 45% chance of re-election. At the same time, the majority government’s model predicts a 75% probability of there being a majority government.
By just judging the chart on its own, it does present some issues and the Neural Net has similar issues in predicting a definitive winner.
This biggest issue in a statistical analysis is the amount of data available for definitive study.
DATA
All charts are set for Ottawa, Ontario.
|
Election Seasonal Ingress |
Date |
Time |
Election Seasonal Ingress |
Date |
Time |
|
1867-Lib_Loss-No_Inc-Maj |
06.21.1867 |
18.2025 |
1953-Lib_Win-IncWin-Maj |
06.21.1953 |
13.0015 |
|
1872-Lib_Loss-IncWin-Maj |
06.20.1872 |
23.3212 |
1957-Lib_Loss-IncLoss-Min |
03.20.1957 |
17.1654 |
|
1874-Lib_Win-IncLoss-Maj |
12.21.1873 |
13.3229 |
1962-Lib_Loss-IncWin-Min |
03.20.1962 |
22.2951 |
|
1878-Lib_Loss-IncLoss-Maj |
06.21.1878 |
10.0405 |
1963-Lib_Win-IncLoss-Min |
03.21.1963 |
4.1951 |
|
1882-Lib_Loss-IncWin-Maj |
03.20.1882 |
13.044 |
1965-Lib_Win-IncWin-Min |
09.23.1965 |
2.0559 |
|
1887-Lib_Loss-IncWin-Maj |
12.21.1886 |
17.1944 |
1968-Lib_Win-IncWin-Maj |
06.21.1968 |
4.1341 |
|
1891-Lib_Loss-IncWin-Maj |
12.21.1890 |
16.4452 |
1972-Lib_Win-IncWin-Min |
09.22.1972 |
18.3247 |
|
1896-Lib_Win-IncLoss-Maj |
06.20.1896 |
18.2818 |
1974-Lib_Win-IncWin-Maj |
06.21.1974 |
14.3802 |
|
1900-Lib_Win-IncWin-Maj |
09.23.1900 |
8.2002 |
1979-Lib_Loss-IncLoss-Min |
03.21.1979 |
1.2216 |
|
1904-Lib_Win-IncWin-Maj |
09.23.1904 |
7.4003 |
1980-Lib_Win-IncLoss-Maj |
12.22.1979 |
7.0951 |
|
1908-Lib_Win-IncWin-Maj |
09.23.1908 |
6.5814 |
1984-Lib_Loss-IncLoss-Maj |
06.21.1984 |
1.0225 |
|
1911-Lib_Loss-IncLoss-Maj |
06.22.1911 |
9.3534 |
1988-Lib_Loss-IncWin-Maj |
09.22.1988 |
15.2838 |
|
1917-Lib_Loss-IncWin-Maj |
09.23.1917 |
10.5958 |
1993-Lib_Win-IncLoss-Maj |
09.22.1993 |
20.2206 |
|
1921-Lib_Win-IncLoss-Min |
09.23.1921 |
10.1932 |
1997-Lib_Win-IncWin-Maj |
03.20.1997 |
9.543 |
|
1925-Lib_Loss-IncLoss-Min |
09.23.1925 |
9.4322 |
2000-Lib_Win-IncWin-Maj |
09.22.2000 |
13.271 |
|
1926-Lib_Win-IncLoss-Maj |
06.22.1926 |
0.3017 |
2004-Lib_Win-IncWin-Min |
06.20.2004 |
20.5637 |
|
1930-Lib_Loss-IncLoss-Maj |
06.21.1930 |
23.5309 |
2006-Lib_Loss-IncLoss-Min |
12.21.2005 |
14.3418 |
|
1935-Lib_Win-IncLoss-Maj |
09.23.1935 |
19.3757 |
2008-Lib_Loss-IncWin-Min |
09.22.2008 |
11.4406 |
|
1940-Lib_Win-IncWin-Maj |
03.20.1940 |
14.2347 |
2011-Lib_Loss-IncWin-Maj |
03.20.2011 |
19.2017 |
|
1945-Lib_Win-IncWin-Maj |
03.20.1945 |
19.3731 |
2015-Lib_Win-IncLoss-Maj |
09.23.2015 |
4.1956 |
|
1949-Lib_Win-IncWin-Maj |
06.21.1949 |
14.0301 |
2019-Lib_Win-IncWin-Min |
09.23.2019 |
3.4925 |
|
1949-Lib_Win-IncWin-Maj |
06.21.1949 |
14.0301 |
2019-Lib_Win-IncWin-Min |
09.23.2019 |
3.4925 |
Book an Astrological Reading
Want to find out more about how astrology affects you?
